Project Dashboard
The Project Dashboard provides valuable metrics including Quality Metrics, Annotator/QC Throughout, and more within the context of the project. To access the Project Dashboard, simply click on the Show Dashboard` button.
Task States & Label Distribution
The task state pie-chart illustrates the distribution of tasks by their respective states within the project. On the other hand, the Label distribution provides a breakdown of annotations within the project tasks.

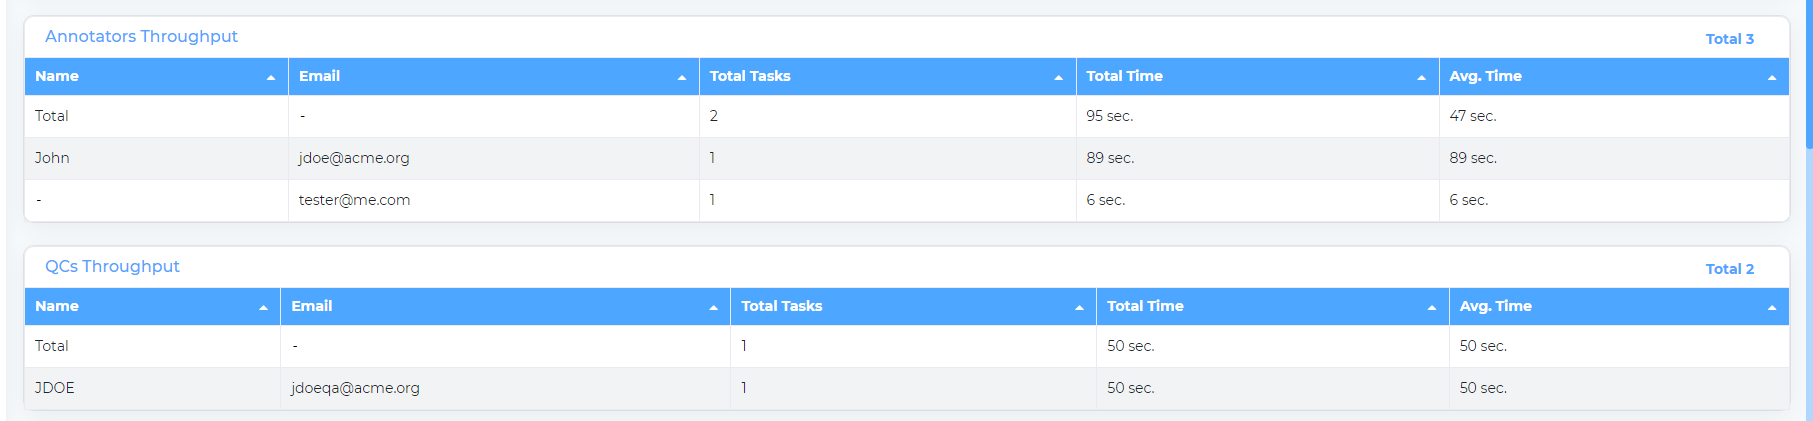
Annotator Throughput & QC Throughput
This dashboard offers insights into the throughput of annotators and QC personnel who collaborate within the project.
Quality Metrics
In projects, once a task is approved, the quality metrics dashboard will be populated with various score parameters including Precision, Recall, F1 Score, and Coheren’s kappa score. These metrics provide an assessment of the quality and performance of the NER annotations.
